“Today, the vogue seems to be an irresistible urge to call VT supraventricular with aberration…” Marriott
A middle-aged male with a complex arrhythmia history contacts EMS after several hours of palpitations.
He has an implantable cardioverter defibrillator (ICD) but denies feeling any activations. He also denies any significant symptoms of dyspnea or discomfort.
Medications: Flecainide, Mexilentine
Vital signs are assessed.
- RR: 18
- HR: 136
- NIBP: 136/91
- SpO2: 99% on room air
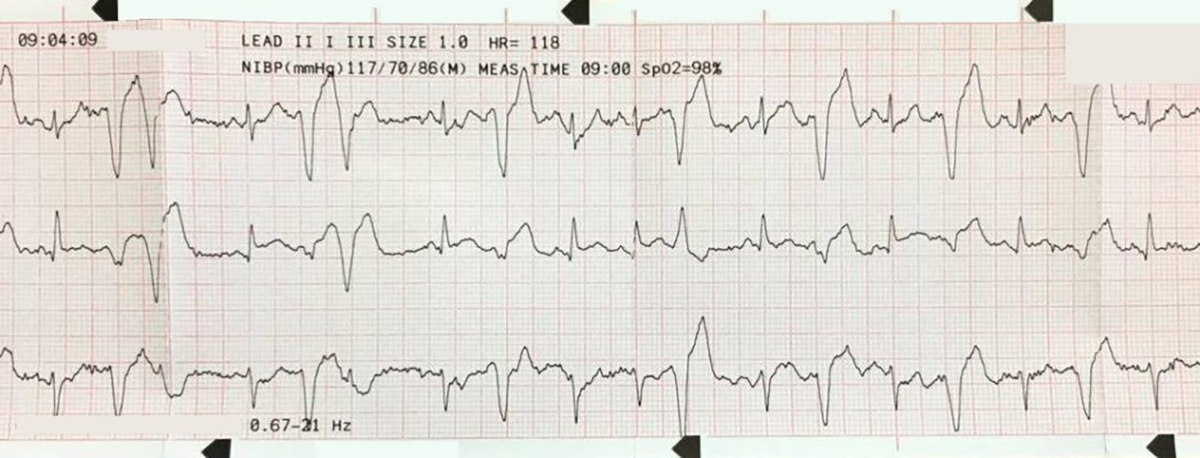
The cardiac monitor is attached.
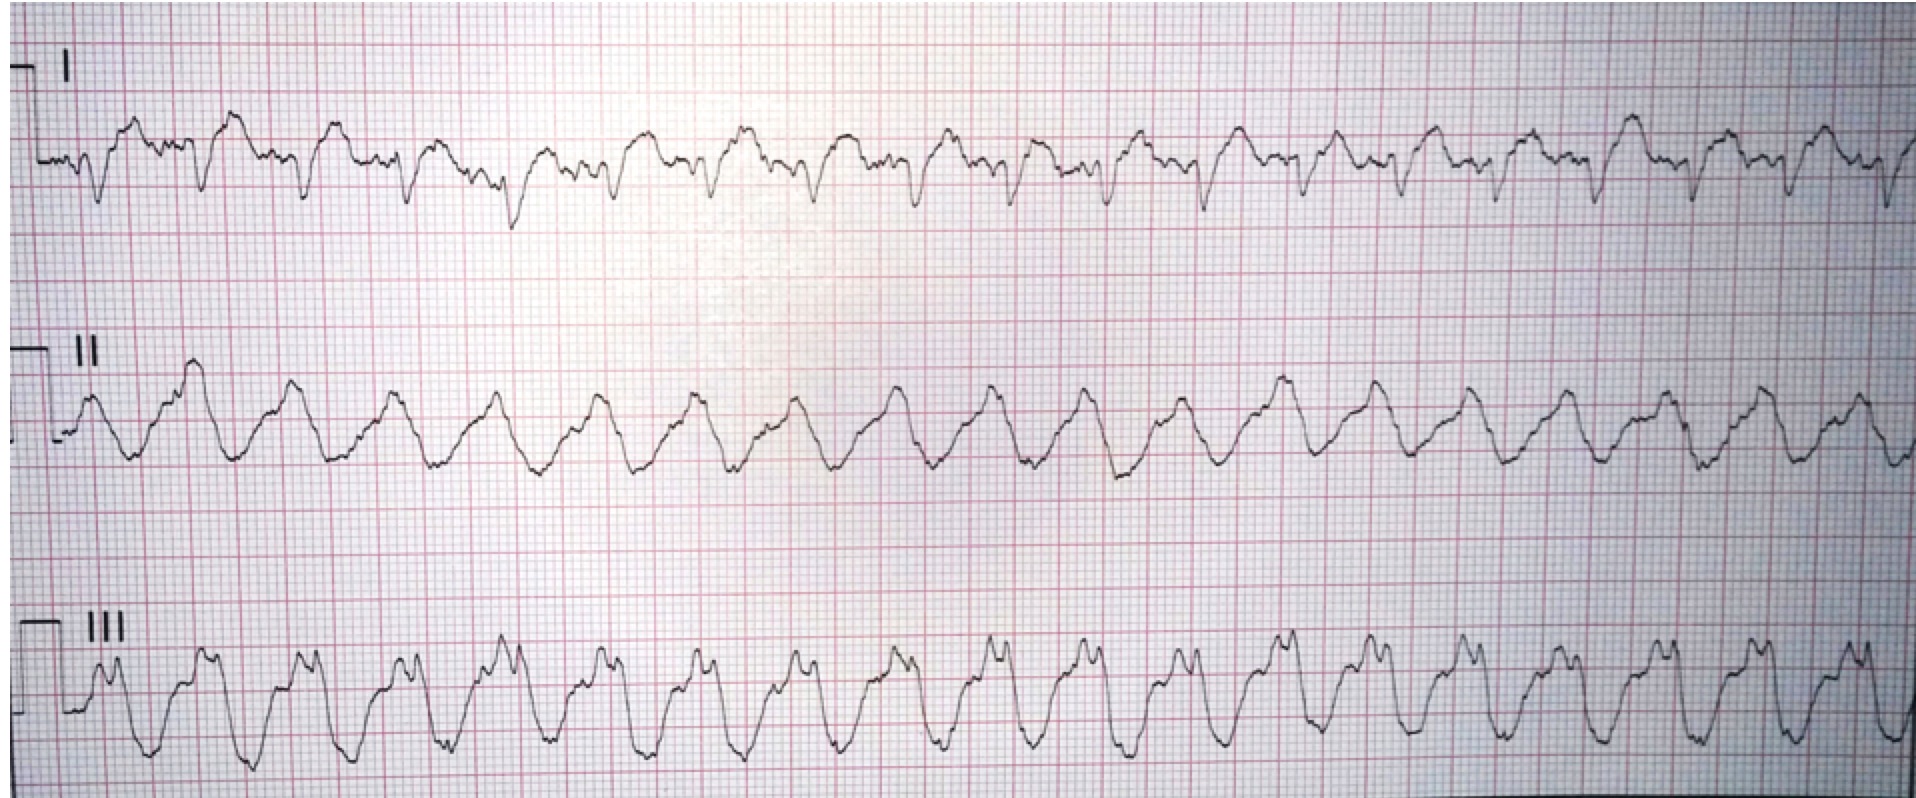
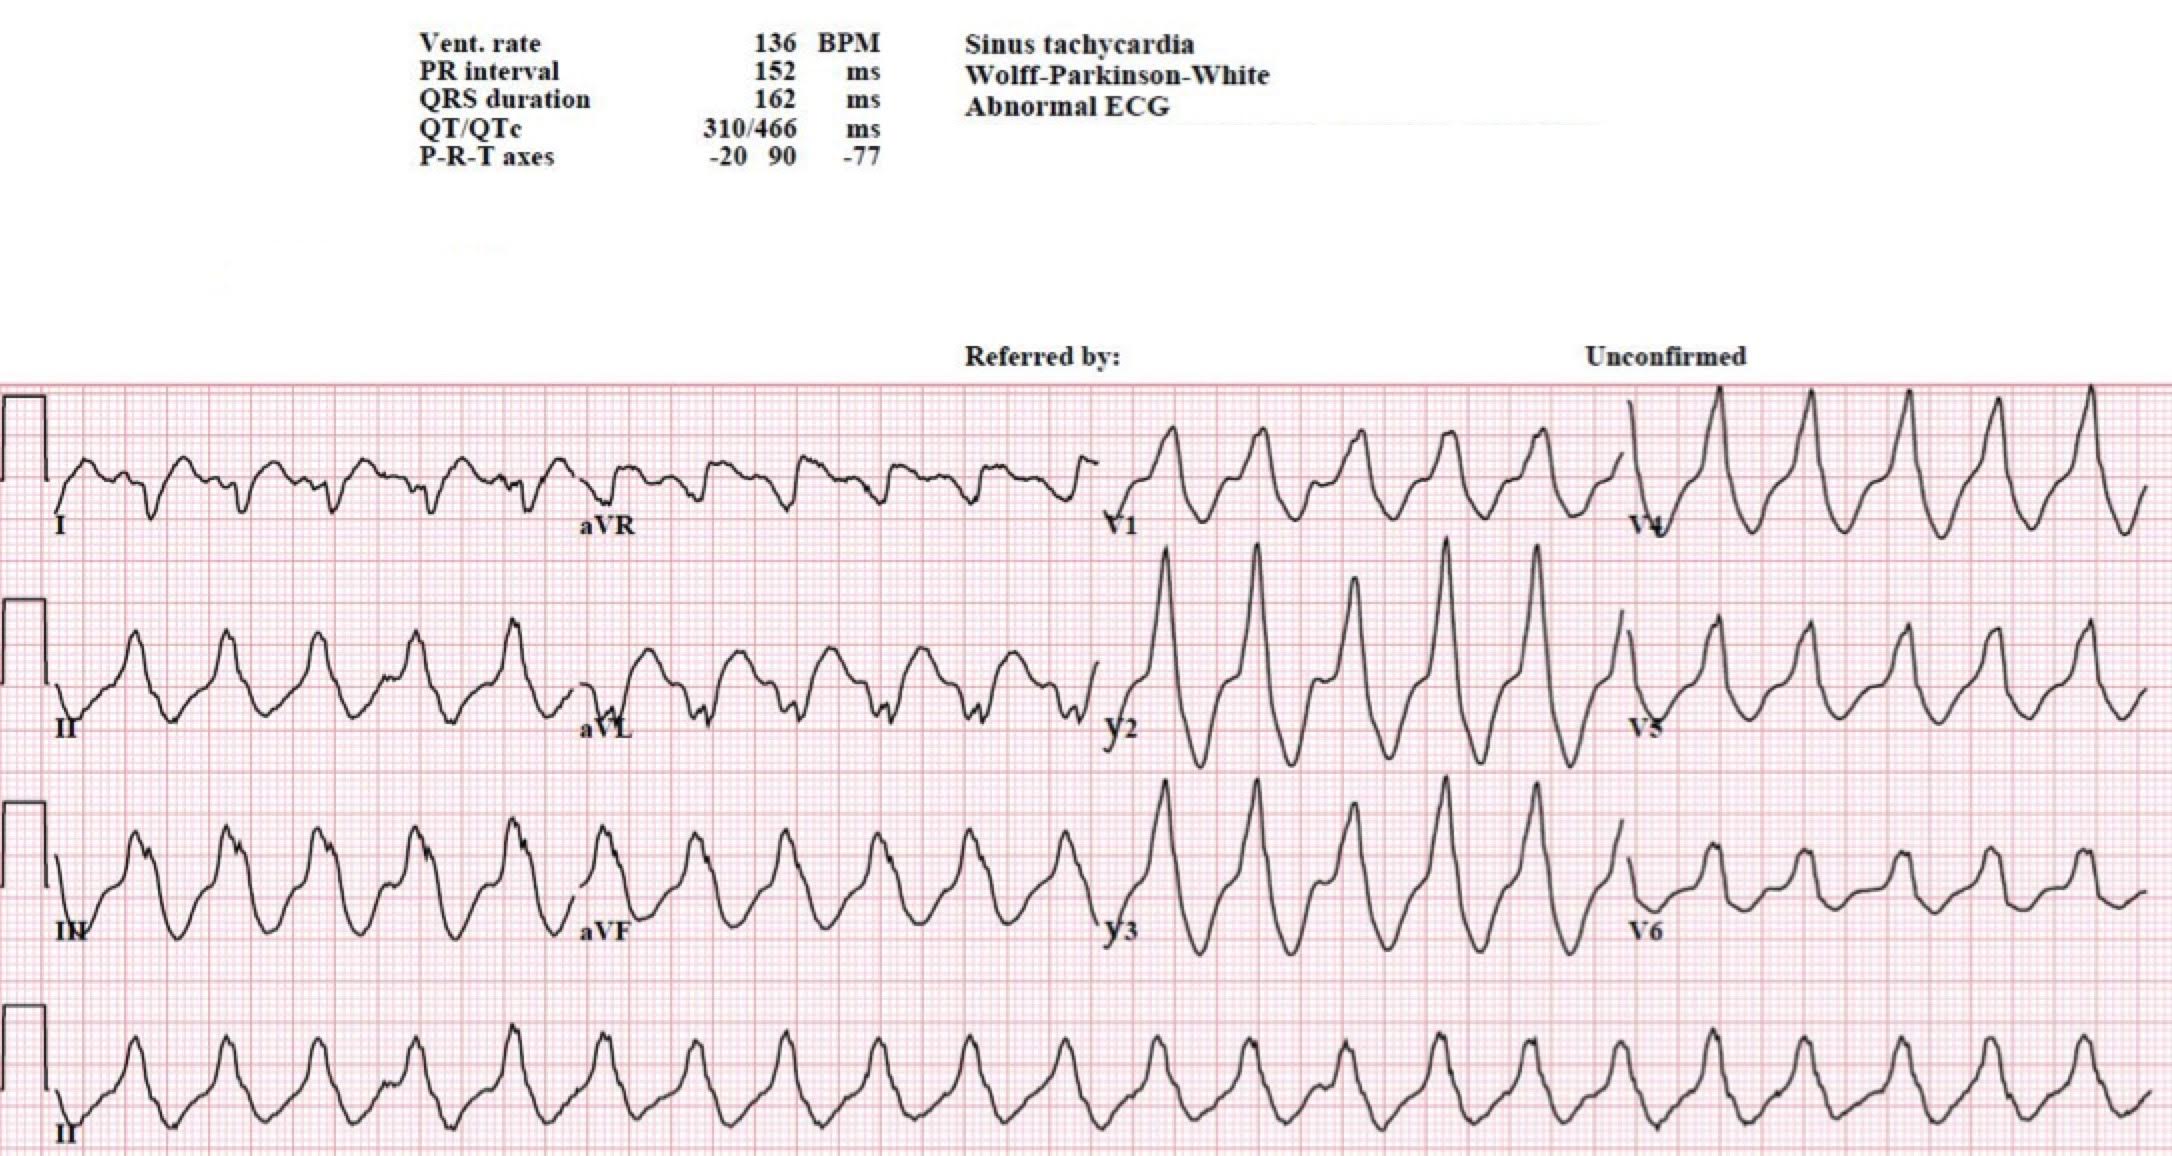
Wide complex tachycardia with a rate of 136.
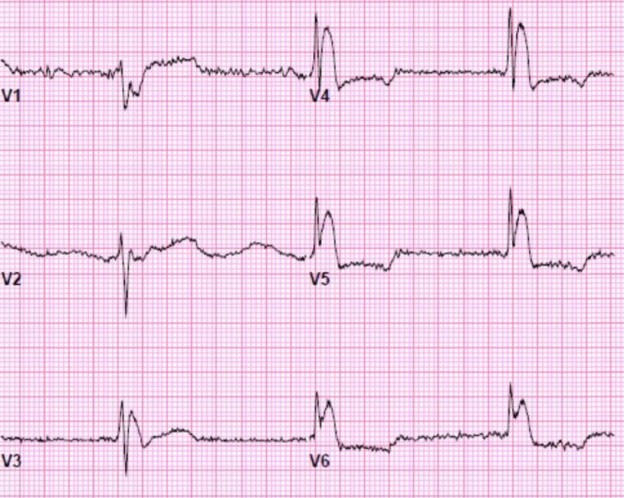
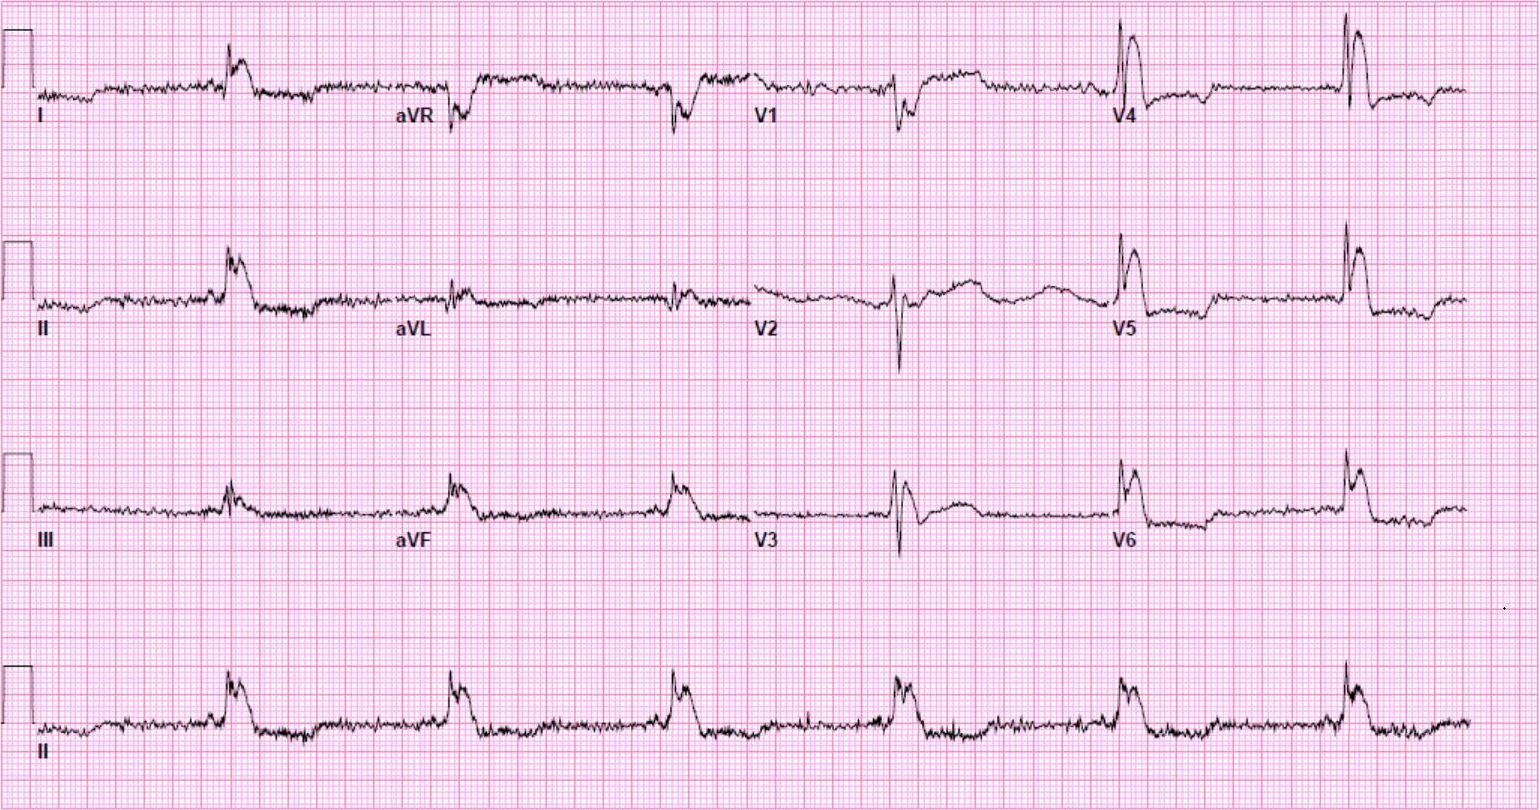
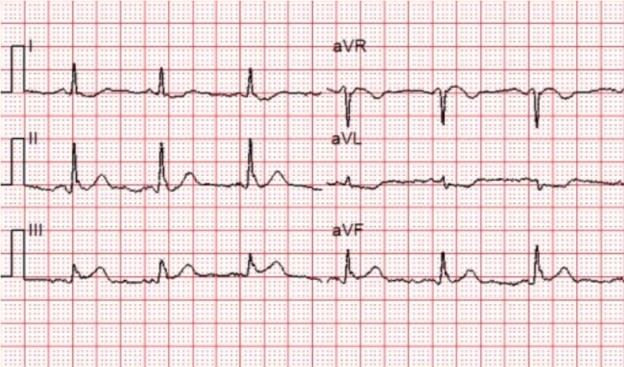
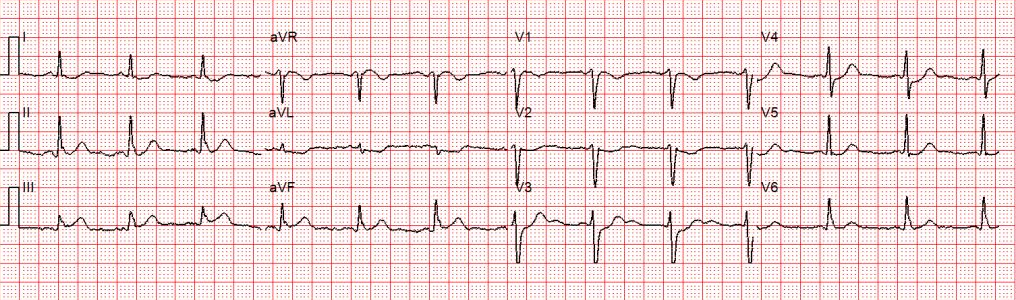
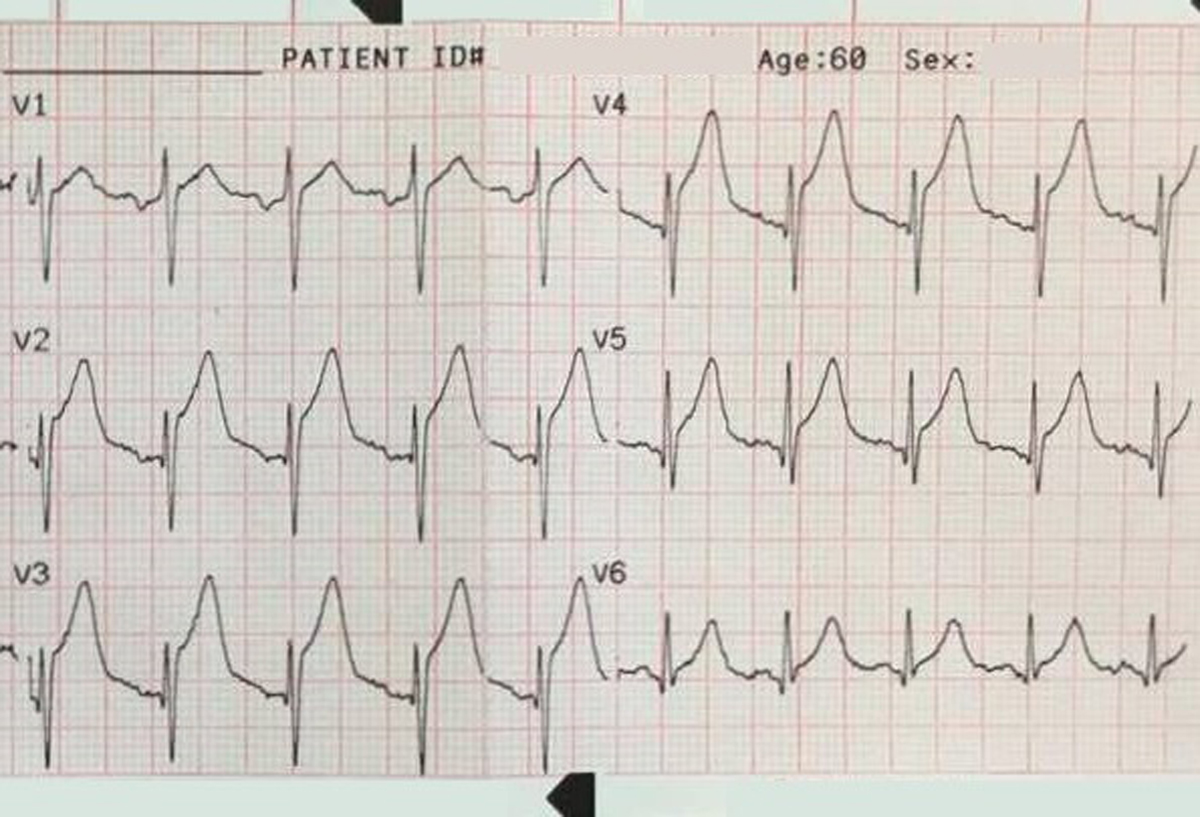
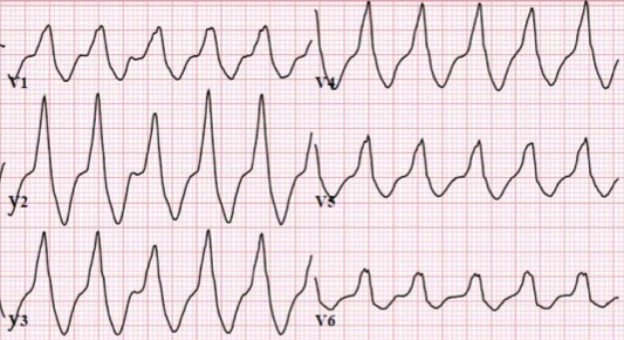
A 12-lead ECG is obtained.
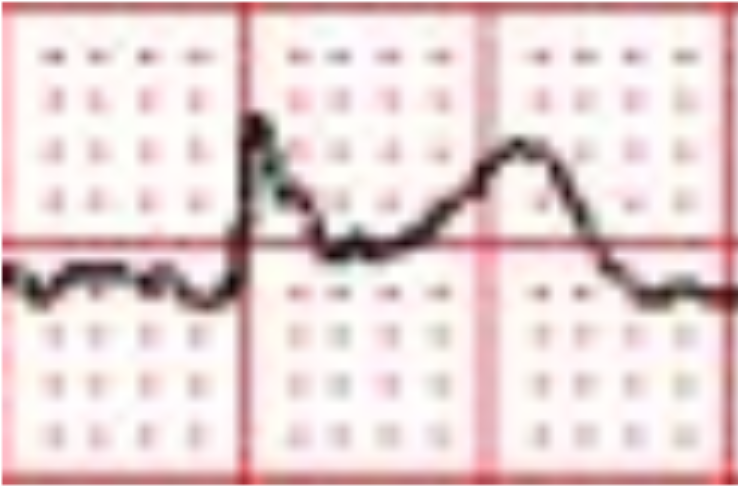
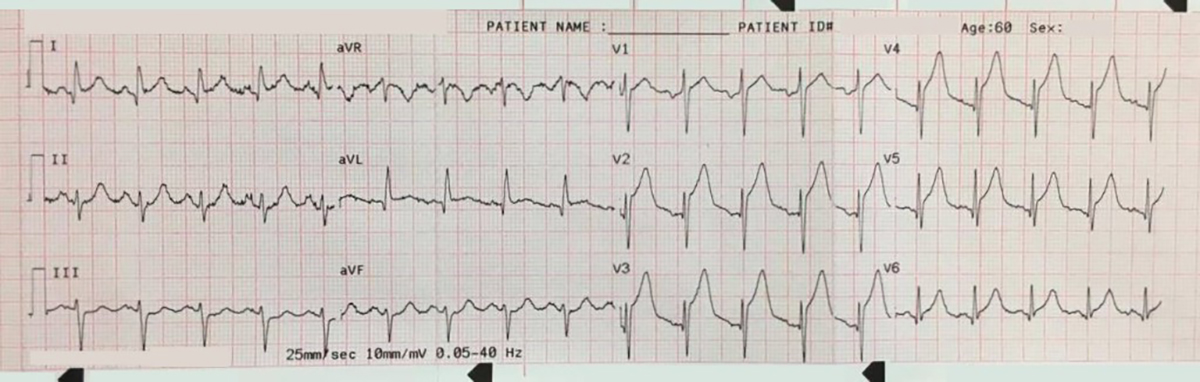
There is a monophasic R-wave in lead V1, a right axis deviation (negative QRS in lead I and positive QRS in leads II and III), with positive concordance of QRS complexes in the precordial leads.
The treating paramedics believed the rhythm was supraventricular tachycardia (SVT) with aberrancy. The patient was transported to the Emergency Department.
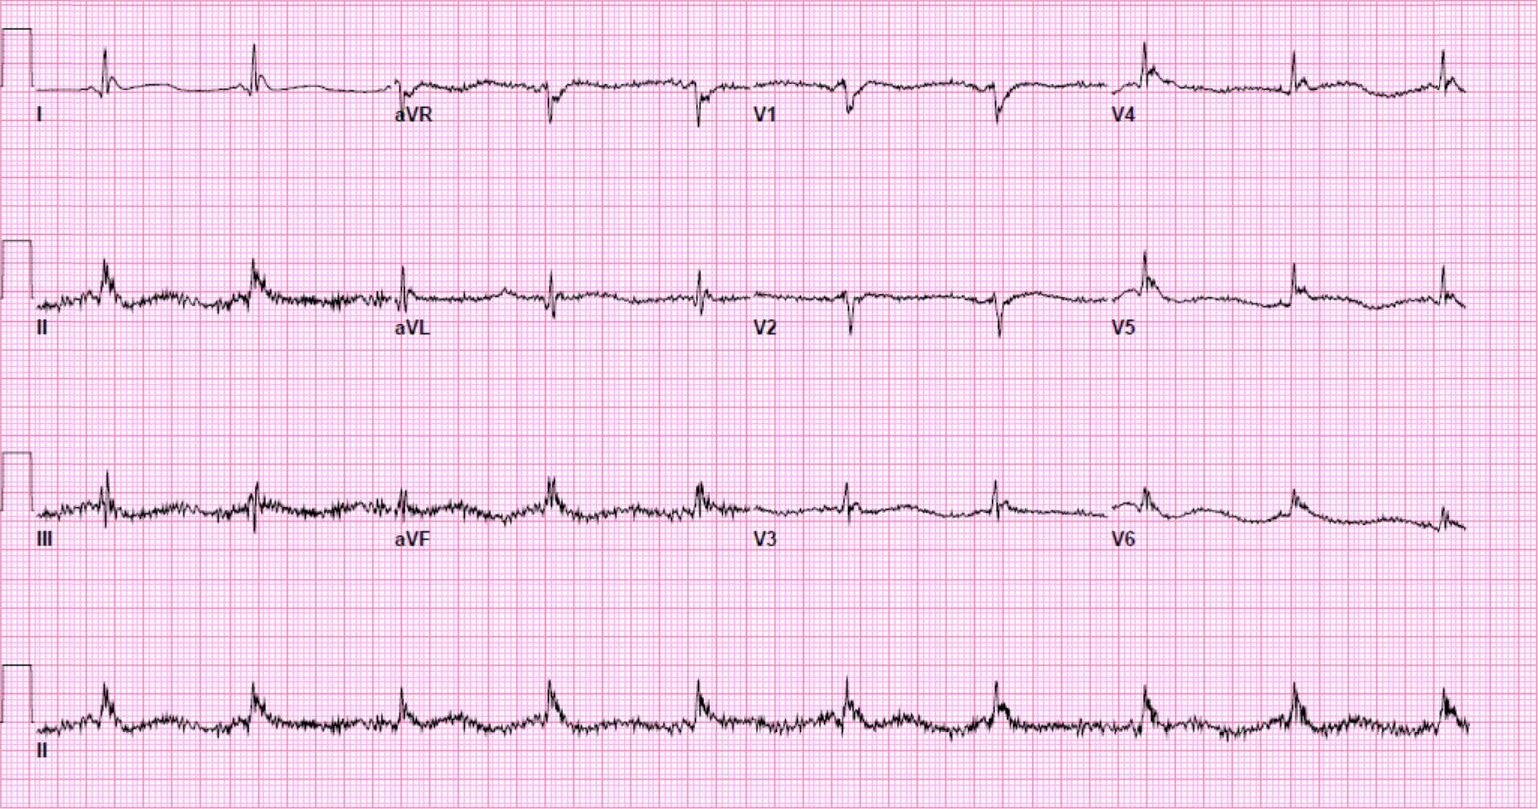
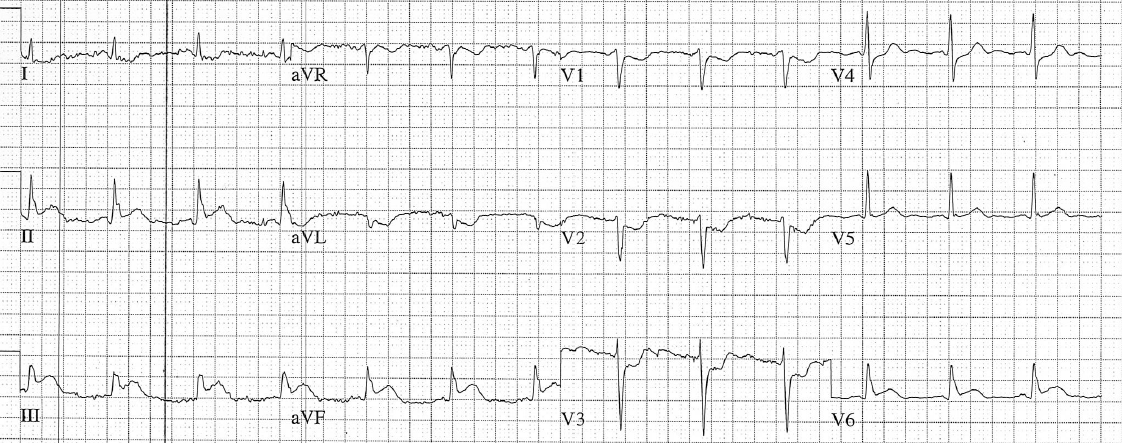
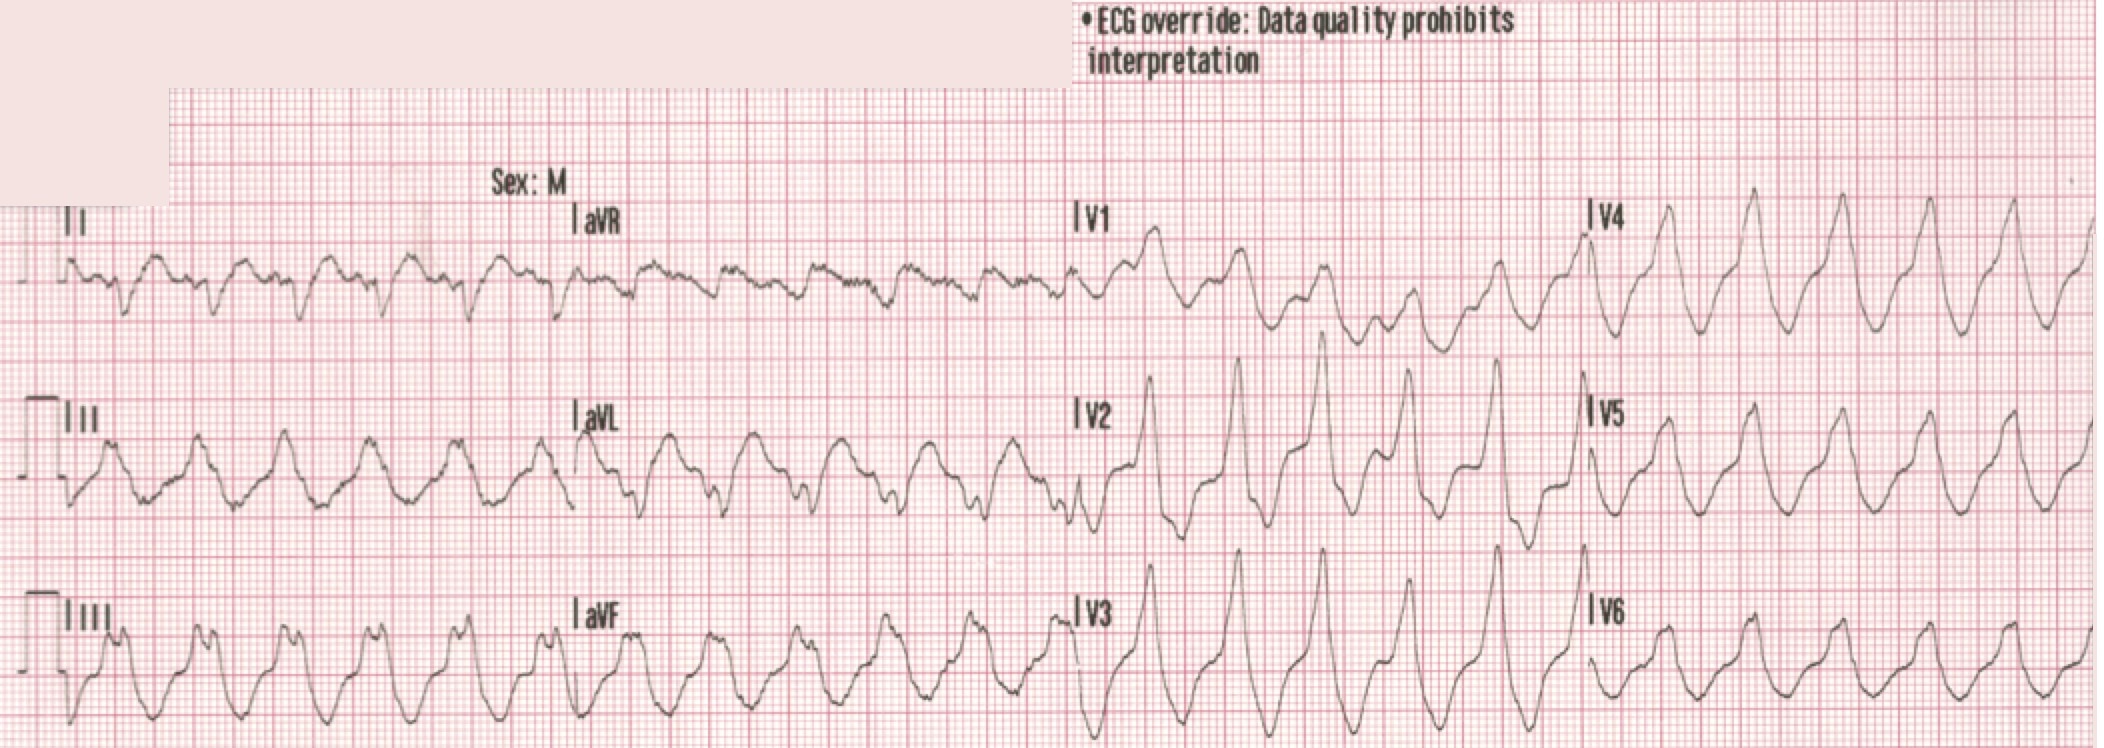
Another 12-lead ECG was obtained on arrival.
Virtually identical to the prehopsital 12-lead ECG.
In the Emergency Department one physician thought the tachycardia might represent atrial fibrillation or SVT with aberrancy. Another wondered if the ECG showed Wolff-Parkinson-White syndrome.
However, a far more likely explanation is ventricular tachycardia (VT).
As Dr. Marriott observed, many clinicians are unable to resist the siren song of aberrant supraventricular tachycardia or atrial fibrillation.
Let’s look at some of the myths and cognitive biases we frequently encounter in the interpretation of wide complex tachycardias.
“I didn’t see an extreme right axis deviation.”
It is true that an extreme right axis deviation (right superior axis) in the frontal plane — “no man’s land” — is strongly supportive of VT. However, the absence of such an axis does not support a supraventricular origin.
If the focus of the VT is in the basal portion of the LV, or the RVOT, an inferior axis (as seen in our patient) will be found.
“The heart rate was too slow to be VT.”
Ventricular rhythms can present with any rate! When the rate exceeds 110-120 bpm we call it VT, while a rate of 50-110 bpm is called accelerated idioventricular rhythm.
Is VT with a rate of 130 unusual? Hardly! One study examined patients who had episodes of VT after ICD placement. Over 30% of the patients had episodes of VT at rates between 101 and 148 bpm. A more recent study found a similar rate of VT episodes at rates between 130 and 186 bpm.
“The rate seemed a little irregular so I thought maybe AF.”
Certainly, gross irregularity should prompt the clinician to consider AF with aberrant conduction! But the rhythm strip and the 12-lead look quite regular here. Having said that, VT can be irregular for brief periods, usually during the initiation or “wind up” phase.
“The patient didn’t have any symptoms even though it had been going on for hours.”
Ventricular tachycardia can be remarkably well tolerated. This patient, in particular, had a normal ejection fraction, no history of MI, and did not have any concurrent illness or intoxication during the episode.
“The ICD didn’t go off, so it probably wasn’t VT.”
Most ICDs are programmed to shock at a particular rate limit — not based on QRS morphology. Modern devices are also capable of anti-tachycardia pacing (ATP) which is not felt by the patient. It turned out that this patient had a “trigger” rate of 182 bpm.
Conclusion
The most important criterion for ventricular tachycardia is “wide and fast”.
In some circumstances it may be possible to distinguish between VT and SVT with aberrancy.
However, the reasons listed above are not sufficient to do so.